
Log ingestion from S3 to ElasticSearch – Upsolver as a Logstash Alternative
As a company working on large distributed systems, we take logging seriously. Thousands of servers send tens of thousands of messages each second, and the amount keeps growing. While reading line by line at this speed is not humanly possible, our customer operations team constantly reviews the logs, correlating across clusters and accounts to uncover issues.
It can be hard to find valuable clues among a flood of less informative messages when analyzing large quantities of logs. Therefore, we wanted a mechanism allowing us to snooze log messages until a specific date (e.g. until a version containing a fix is deployed) to focus on the interesting error messages.
How logging is done in Upsolver #
Upsolver servers typically run in the customer’s account (usually AWS). Logs produced by those servers are sent to our own AWS account. Each Upsolver server runs several Docker containers:
- Upsolver services (depending on cluster type): compute, query, API etc.
- fluentd for logs
- telegraf for metrics
The old log pipeline: #
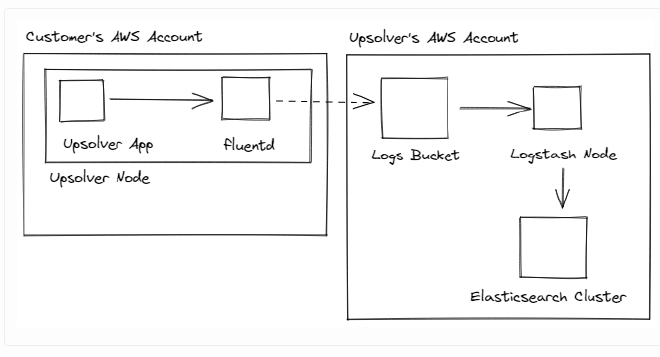
We ship the logs via fluentd to an S3 bucket in our account. Logstash then loads these into an Elasticsearch cluster.
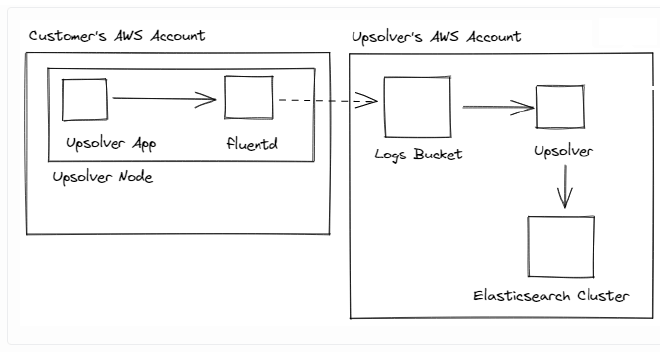
Migrating from Logstash to Upsolver #
As the number of servers increased, our Logstash instance had a hard time keeping up. Scaling the Logstash cluster would have been an option, but the situation caused us to review the use case and consider alternatives.
We decided that our own system could handle the load and would provide added benefits:
- a log pipeline using Upsolver turns out to be easy to set up and maintain
- a single-node Upsolver cluster is more performant to start with, and scaling to several nodes is trivial
- eliminating Logstash simplifies our setup
- while Upsolver is not specialized in logging use cases, we can easily customize it by just modifying some queries in Upsolver SQL
- dogfooding helps us improve our product
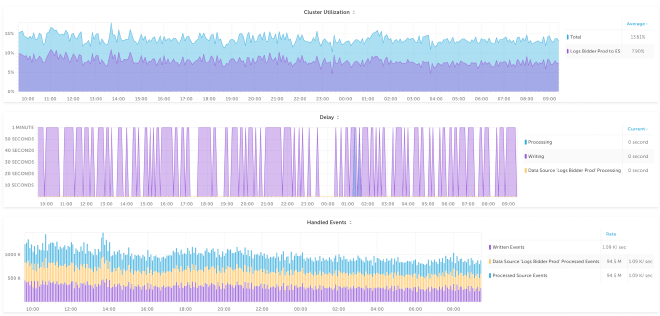
Replacing Logstash with Upsolver: #
In addition to the above, replacing Logstash with Upsolver also gives us better monitoring out of the box. For example, the graphs (below) show the delays associated with ingestion, data processing and writing, so we can pinpoint throughput issues and add alerts if necessary.
Setting up the new pipeline took about 10 minutes and involved creating an S3 data source in Upsolver and then an Elasticsearch output using the following SQL statement:
SELECT
  TO_UNIX_EPOCH_MILLIS(TO_DATE(data."@timestamp")) as "@timestamp",
  data.* as *,
  headers.head.* as headers.*
  FROM "Logs"
Bonus feature: Snoozing logs #
So far our pipeline is just forwarding the logs. However, we mentioned above that we want the ability to suppress log messages matching specific patterns, sometimes just for a specific period of time.
To do so, we provide Upsolver with a JSON file which we can then access like a table. The format is as follows:
[
  {
    "operation-id": "*",
    "cluster-id": "*",
    "organization-id": "a02ec08b-10c8-48fd-b7ad-d89bb6a96ebb",
    "logger": "com.upsolver.ExampleComponent.FooWidget",
    "end-time": "2021-06-28T15:20:24.735073Z"
  }, ...
]
We then match each message against these filters and add the result of the match as a boolean value named known-ops-error to the message.
The semantics of the file are as follows:
- Each of
operation-id,cluster-id,organization-idand logger specifies an exact match condition (or*to match any value), and the individual fields are combined to a match rule usingAND. - The validity of a match rule can be limited by specifying a value for the
end-timefield.
The final SQL statement of the logs output to ES looks like this:
SELECT TO_UNIX_EPOCH_MILLIS(TO_DATE(data."@timestamp")) AS "@timestamp",
       data.* AS *,
       headers.head.* AS headers.*,
       -- OR when applied to an array will return true if any of the values are true
       OR(TO_DATE(known_errors[]."end-time") > TO_DATE(data."@timestamp")) AS known_ops_error
  -- We access the configuration file as if it was a table
  FROM "Logs" LEFT JOIN "known-ops-errors.json" known_errors
      -- The following line is equivalent to known_errors."cluster-id" IN ('*', data."cluster_id") in ANSI SQL
      -- Same goes for the other three lines
      ON known_errors."cluster-id" = [ '*', data."cluster_id" ]
     AND known_errors."organization-id" = [ '*', data."organization-id" ]
     AND known_errors."logger" = [ '*', data."logger" ]
     AND known_errors."operation-id" = [ '*', data."operation-id" ]
Conclusion #
We have eliminated Logstash as a separate system to be maintained and gained throughput and easy extensibility by using Upsolver.
While not all of the features of Logstash can be replicated one-to-one in Upsolver, the new pipeline fits our use case well and simplifies our operations.
The customer operations team can now snooze error messages until they are meant to be resolved and focus on new errors.